BOOKS - STROKE: Analysis and Prediction Using Scikit-Learn, Keras, and TensorFlow wit...

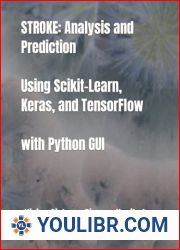
STROKE: Analysis and Prediction Using Scikit-Learn, Keras, and TensorFlow with Python GUI
Author: Vivian Siahaan
Year: September 8, 2021
Format: PDF
File size: PDF 15 MB
Language: English
Year: September 8, 2021
Format: PDF
File size: PDF 15 MB
Language: English
In this project, we will perform an analysis and prediction task on stroke data using machine learning and deep learning techniques. The entire process will be implemented with Python GUI for a user-friendly experience. We start by exploring the stroke dataset, which contains information about various factors related to individuals and their likelihood of experiencing a stroke. We load the dataset and examine its structure, features, and statistical summary. Next, we preprocess the data to ensure its suitability for training machine learning models. This involves handling missing values, encoding categorical variables, and scaling numerical features. We utilize techniques such as data imputation and label encoding.To gain insights from the data, we visualize its distribution and relationships between variables. We create plots such as histograms, scatter plots, and correlation matrices to understand the patterns and correlations in the data. To improve model performance and reduce dimensionality, we select the most relevant features for prediction. We employ techniques such as correlation analysis, feature importance ranking, and domain knowledge to identify the key predictors of stroke.Before training our models, we split the dataset into training and testing subsets. The training set will be used to train the models, while the testing set will evaluate their performance on unseen data. We construct several machine learning models to predict stroke. These models include Support Vector, Logistic Regression, K-Nearest Neighbors (KNN), Decision Tree, Random Forest, Gradient Boosting, Light Gradient Boosting, Naive Bayes, Adaboost, and XGBoost. Each model is built and trained using the training dataset.We train each model on the training dataset and evaluate its performance using appropriate metrics such as accuracy, precision, recall, and F1-score. This helps us assess how well the models can predict stroke based on the given features. To optimize the models' performance, we perform hyperparameter tuning using techniques like grid search or randomized search. This involves systematically exploring different combinations of hyperparameters to find the best configuration for each model. After training and tuning the models, we save them to disk using joblib. This allows us to reuse the trained models for future predictions without having to train them again.With the models trained and saved, we move on to implementing the Python GUI. We utilize PyQt libraries to create an interactive graphical user interface that provides a seamless user experience. The GUI consists of various components such as buttons, checkboxes, input fields, and plots. These components allow users to interact with the application, select prediction models, and visualize the results.In addition to the machine learning models, we also implement an ANN using TensorFlow. The ANN is trained on the preprocessed dataset, and its architecture consists of a dense layer with a sigmoid activation function. We train the ANN on the training dataset, monitoring its performance using metrics like loss and accuracy. We visualize the training progress by plotting the loss and accuracy curves over epochs. Once the ANN is trained, we save the model to disk using the h5 format. This allows us to load the trained ANN for future predictions. In the GUI, users have the option to choose the ANN as the prediction model. When selected, the ANN model is loaded from disk, and predictions are made on the testing dataset. The predicted labels are compared with the true labels for evaluation.To assess the accuracy of the ANN predictions, we calculate various evaluation metrics such as accuracy score, precision, recall, and classification report. These metrics provide insights into the ANN's performance in predicting stroke. We create plots to visualize the results of the ANN predictions. And so on.


